Fresh Produce Market Analysis: A Mixed Bag in August

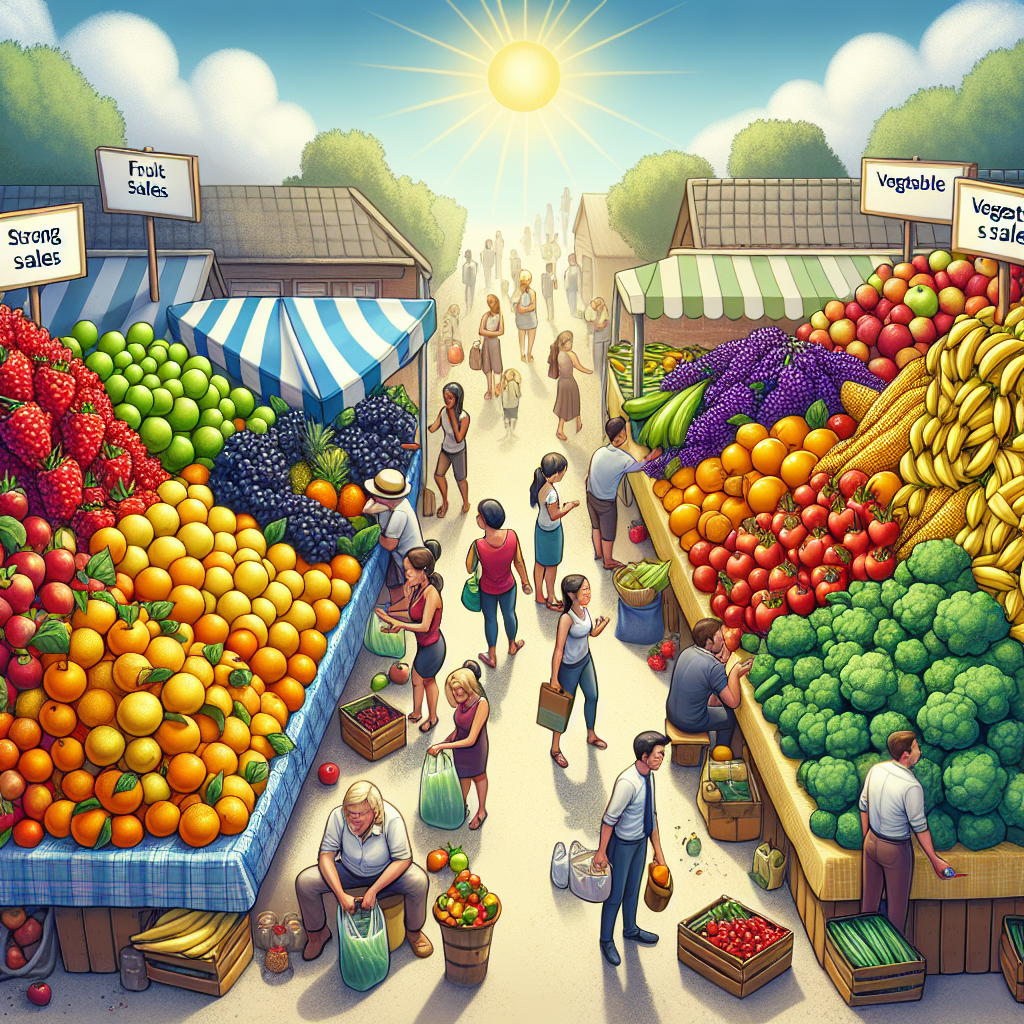
In an era characterized by fluctuating consumer sentiments and a constantly shifting retail landscape, the fresh produce sector showcased a “tale of two categories” in August 2025. After a mild uptick in July—the first instance of growth in many months—veggie dollar and volume sales once again fell behind year-ago levels. In contrast, fruit enjoyed a robust performance, contributing eight of the top ten growth commodities in absolute dollar gains within the grocery industry, as reported by Anne-Marie Roerink, president of 210 Analytics.
Retail Overview for August
Consumer prices surged by 2.9 percent in August, marking the most significant increase since January, while jobless claims reached a four-year high. The University of Michigan noted a decline in U.S. consumer sentiment to 58.2 in August, dropping from 61.7 in July—the first decline in four months—reflecting growing concerns about inflation.
In the retail food and beverage sector, total sales remained on a plateau, consistent with the flat-to-down trajectory observed in recent months. According to Circana’s MULO+ data, dollar sales rose by 2.7 percent in August, though unit sales dipped by 0.4 percent compared to August 2024.
Shifting consumer priorities have led to a focus on value-seeking, essentials, and promotional responsiveness, even as consumers display a willingness to trade up for better quality and wellness benefits. Supermarkets, famous for their high-low pricing strategies, accounted for 42.2 percent of all food and beverage unit sales in August, down from 47.3 percent in 2021. Rising channels include mass retailers, clubs, and e-commerce.
Inflation Insights
During the five weeks ending August 31, the price per unit across all foods and beverages stood at $4.37, indicating a renewed upswing in inflation. The average price per unit for total food and beverages rose by 3.1 percent, driven principally by commodity volatility affecting various categories directly and indirectly.
Specifically, center-store prices averaged $4.12, reflecting a 3 cents increase from July and a 3.3 percent year-on-year rise. Perishables saw their prices increase to $4.31 per unit, marking a 3.4 percent rise over August 2024. Notably, August’s fresh produce prices saw a 3.5 percent inflation rate for fresh fruit, surpassing the overall food and beverage inflation rate. After a protracted period of deflation, fresh vegetable prices rose by 1.2 percent, averaging $2.03 per pound.
Fresh Produce Sales Performance
In August, fresh produce sales totaled $9.3 billion, making it the third-largest department trailing only meat and dairy. Dollar sales increased by 2.9 percent year-over-year, while volume achieved a modest gain of 0.6 percent. Once again, fruits drove growth in both dollar and volume sales. In contrast, vegetable sales remained largely stagnant in dollars and saw a 1.3 percent decline in pounds sold.
Frozen fruit also outperformed frozen vegetables in the frozen food department, collectively generating $953 million and showing increases in dollars, units, and pounds. However, shelf-stable fruits and vegetable sales continued their downward trend.
Top Performers in Fresh Produce
On the fruit front, berries, melons, and grapes commanded sales. The berry category alone surpassed $1 billion in August, with volume up more than 9 percent. Other fruits demonstrating volume growth included bananas, avocados, cherries, peaches, mandarins, and pineapples. Interestingly, apples were the only item in the top ten categories that lost ground in terms of volume.
Meanwhile, vegetables witnessed a decline in both dollar and volume sales. For the first time in years, all top ten vegetable sellers reported a decrease in pounds sold. Notably, salad kits, lettuce, and mushrooms faced the steepest declines, while tomatoes, potatoes, peppers, and carrots managed to stay closer to year-ago performance.
Over the course of individual weeks in August, weekly sales fluctuated between $1.8 billion and $1.9 billion. Though all five weeks registered dollar gains, the first and fifth weeks experienced volume losses, offset by strong middle-week performance, primarily driven by fruit sales.
Produce Absolute Dollar Gains
When assessing the top ten commodities that generated the most dollar growth in August, the berry category led the way, adding nearly $90 million in new dollars compared to August 2024. Cherries followed closely, contributing an additional $57 million in sales. Interestingly, sweet potatoes and potatoes were the only vegetable categories to make it onto the top ten dollar growth list for August.
RELATED: Retail Trends Reshaping Produce Ahead Of IFPA Show
This structured article is ready for seamless integration into WordPress and adheres to best practices for HTML formatting and readability.


